Overview
Better Than Rules Of Thumb: Choosing Risk Distributions By Testing Behaviour, Not Opinion
Distribution choice is not a style preference. It quietly decides what your model is allowed to believe about uncertainty. Once it is baked in, people start treating outputs like objective truth.
"Use PERT" and "Triangular is conservative" sound helpful, until you see what they do to exposure on big ticket risks.
In project risk modelling we debate inputs all day, Best Case (BC), Most Likely (ML), Worst Case (WC) scenarios, correlations, durations. But we often treat the distribution as a default. That is where credibility quietly leaks.
This article is the first in a short series on modelling uncertainty based on how risks actually behave in complex projects, rather than forcing everything into familiar templates.
This article is my attempt to reset the conversation:
Not "which distribution is best?"
But "what does this choice imply about uncertainty, and can I defend that implication for this risk, at this stage of the project?"
I'll keep it grounded in real modelling using @Risk in Excel, because it forces you to face what the curve is actually doing.
Distributions are assumptions, not math choices
A distribution is not just a curve that "fits" your three points. It is a statement of belief about what happens between the points, and sometimes beyond them.
When you pick a distribution, you are implicitly choosing:
How strongly you believe the ML is a "magnet"
How much weight sits in the tails
Whether outcomes outside your bounds are possible, bounded versus unbounded
How exposure is shaped, where mean and tail metrics can move materially even when BC, ML, WC stay the same, and this is where @Risk Alt distributions become very relevant.
That is why one size fits all advice is risky. Two modellers can use the same BC, ML, WC and still produce meaningfully different exposure and confidence outcomes, simply because the uncertainty story is different.
A quick reality check: exposure versus "what we think will happen"
In plain terms:
P50 tells you the midpoint outcome
P90 tells you the high end outcome, where uncertainty bites
Mean tells you where the exposure centre of gravity sits
Two distributions can look similar around the middle, but allocate probability very differently in the upper tail. That is exactly how you end up in P90 debates that feel confusing or political.
Project stage matters more than preferences
There is rarely a single "best" distribution across a project lifecycle. The more useful question is best for when.
Early stage, wide and messy uncertaintyDesign is immature, scope evolves, and evidence is limited. The ML is often not a strong attractor, it is simply the best guess someone is willing to state. Over-concentrating probability around ML can turn uncertainty into false precision. This is also when tails matter most, because surprises and constraints tend to emerge here.
Later stage, narrower uncertainty but persistent tail riskAs delivery progresses, evidence improves, which can justify tightening probability toward ML, but only when ML is genuinely supported by data and a credible scenario. Collapsing the tail too aggressively can produce a reassuring model that still leaves the organisation exposed.
Before debating PERT versus Triangular, it is worth stepping back and asking a more fundamental question:
Are you modelling uncertainty as bounded or unbounded?
This sounds academic, but it is not. This single decision often shapes tail behaviour more than any debate about specific distribution types.
Bounded distributions assert that outcomes outside defined limits are not plausible for the risk. In many projects this is defensible due to quantities, contract caps, physical constraints, practical delivery limits, and plain plausibility.
Unbounded distributions explicitly state that extreme outcomes are possible, rare but possible. Sometimes this is appropriate. Often it is applied by habit. When tail behaviour has not been deliberately considered, high percentiles become highly sensitive to distribution choice and parameterisation.
You will hear two kinds of claims:
"PERT is safer because it is bounded."
"PERT is unbounded and can go negative even when the minimum is zero."
The second claim is simply incorrect.PERT is boundedand if you set the minimum to zero, negative values are not possible by construction. In @Risk, RiskTheoMin() and RiskTheoMax() confirm the theoretical limits are exactly the defined bounds.
The real point, though, is this: being bounded does not automatically make something realistic. A bounded distribution only protects you from outcomes outside the bounds you define. If your bounds are not credible, the curve just gives you an elegant picture of an unreliable assumption.
Practical modelling lens: stop staring at the curve, interrogate the sampling
Most debates happen at the label level, "PERT is better", "Triangular is conservative". The model does not care about labels. It cares where it spends its time, especially on big ticket risks.
Making distributions interpretable
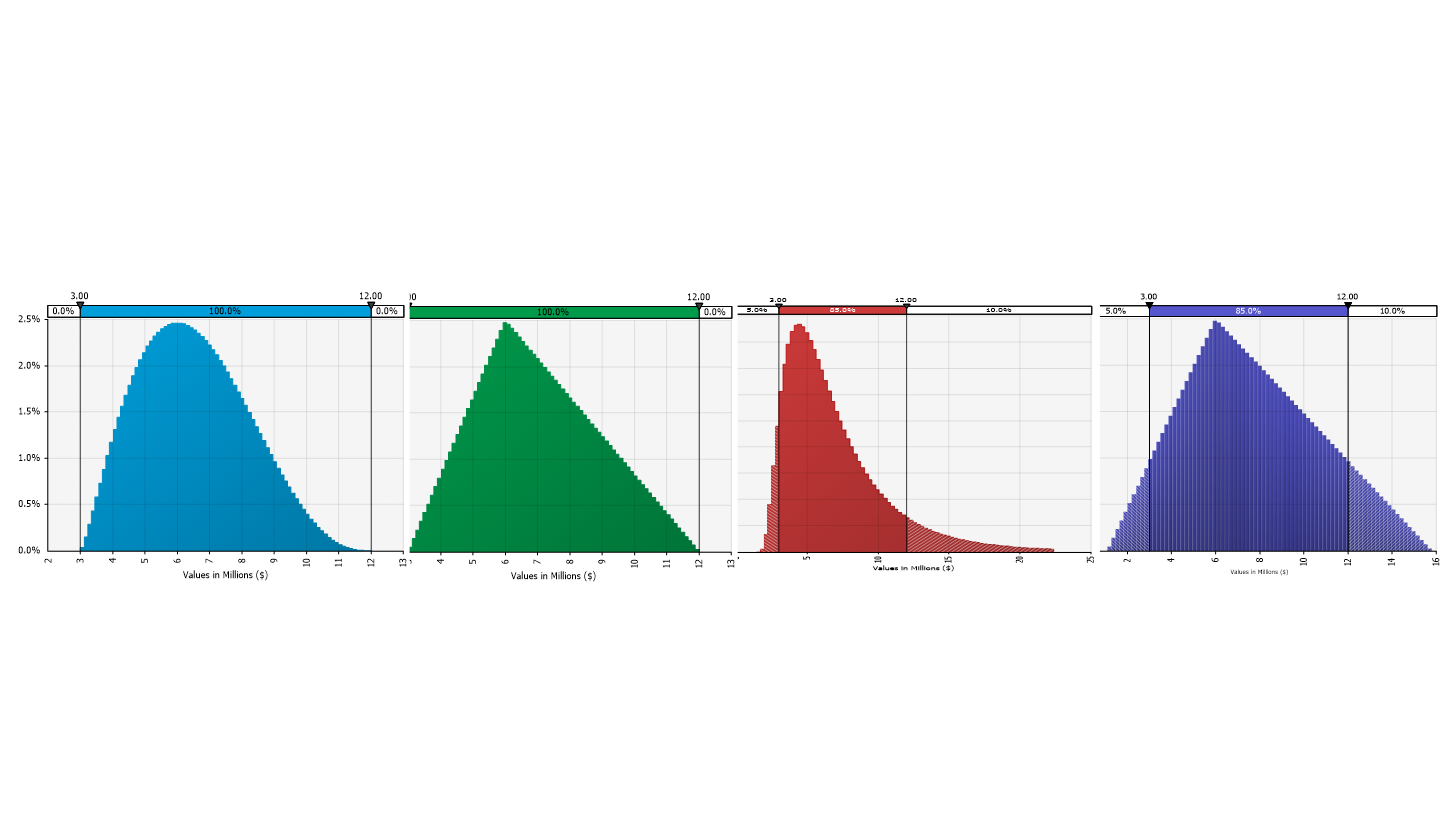
One reason many people struggle with distribution charts is that they simply do not know what the Y-axis represents. By default in @Risk, the scale shows values that are mathematically correct but not intuitive, so people cannot easily interpret what the distribution is telling them.
What I do first is change the chart setting to Relative Frequency. This switches the Y-axis to a percentage scale, which makes it immediately clear how frequently values are being generated across the distribution.
I then reduce the number of bins. The histogram turns into a set of bars, where each bar represents a range along the X-axis, and the height of each bar shows the probability of generated samples coming from that range. At that point, the distribution stops being abstract and becomes something you can reason about in plain terms (Figure 1).
Visual interrogation beats opinion
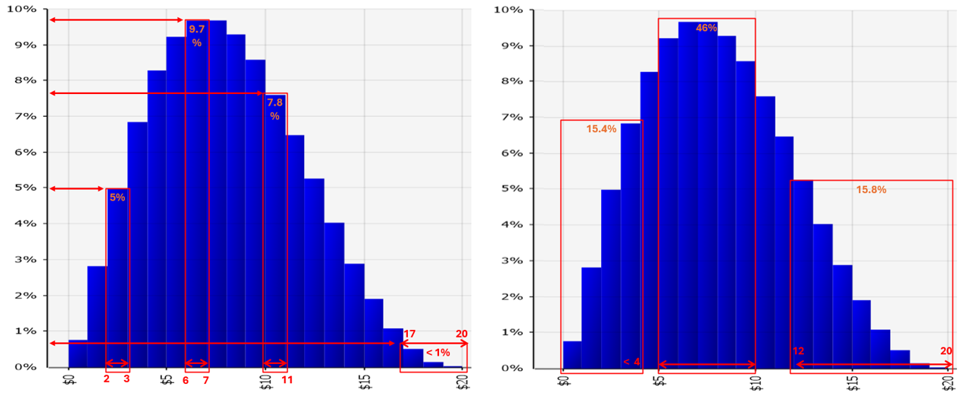
If there's one habit I wish more practitioners adopted, it's this: overlay distributions using the same inputs and see what actually changes.
Overlaying makes behaviour visible, where probability concentrates, where it spreads, how the upper tail is treated, and why P90 can move even when BC, ML, and WC do not.
Use delimiters and vertical markers to ask concrete questions: what is the probability above a threshold, how much mass sits in a given range, and how often the model visits the upper end (Figure 2).
That's where rules of thumb fall away and defensible choices begin.
Shaping bounded uncertainty without jumping to unbounded tails
Sometimes neither plain Triangular nor plain PERT matches what you believe. You might want to stay bounded, but you want more control over how probability builds and tapers.
Trigen: keep the triangular logic, tune the weighting
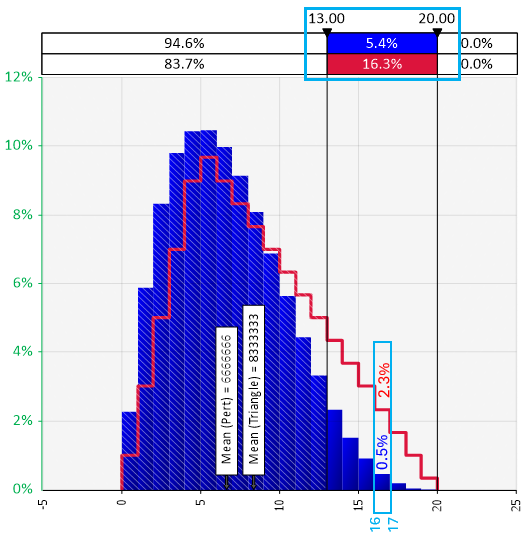
Triangular is simple and transparent, but it hard codes a spread pattern. In real workshops, estimates often carry optimism bias or conservatism, and you cannot always "correct" the numbers in the room.
Trigen (in @Risk) is useful because it keeps the three-point story, while letting you adjust how probability is weighted within the range. It is a practical way to respond when you can see the implied uncertainty does not feel right, without rewriting the estimates (Figure 3).
RiskPertAlt: PERT style behaviour with percentile bounds
Sometimes BC and WC are not true extremes, they are lowest and highest credible outcomes. RiskPertAltlets you work with percentile style bounds, which can match how uncertainty is described in workshops.
Note:Trigen and RiskPertAlt behaviour
Depending on how you set the percentile bounds, the theoretical minimum can fall below your stated BC, and that can mean negative values. If negative values are not meaningful, set the lower percentile to 0% (or otherwise constrain the lower side appropriately) so the distribution cannot go below your intended floor.
Lognormal: an option, not a default
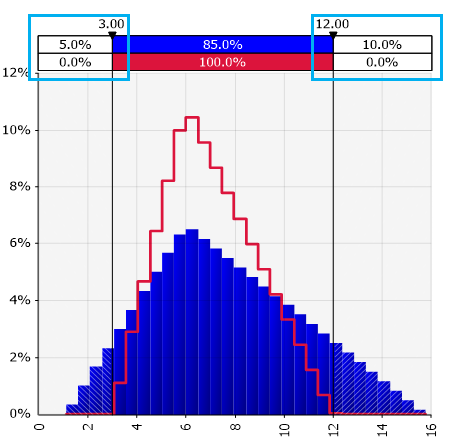
Lognormal is tempting because it produces right skew. But it also implies an unbounded upper tail. Sometimes that matches the mechanism. Often it quietly introduces uncontrolled tails and makes high percentiles overly sensitive.
LognormAlt helps with parameterisation, not philosophy. It makes inputs more interpretable, but it does not change what lognormal implies about tails. If you need lognormal like skew but cannot justify infinite tails, truncation can be appropriate, but it should be deliberate and justified because it changes behaviour and can shift the mean (Figure 4).
Closing: a repeatable way to choose distributions, and defend the choice
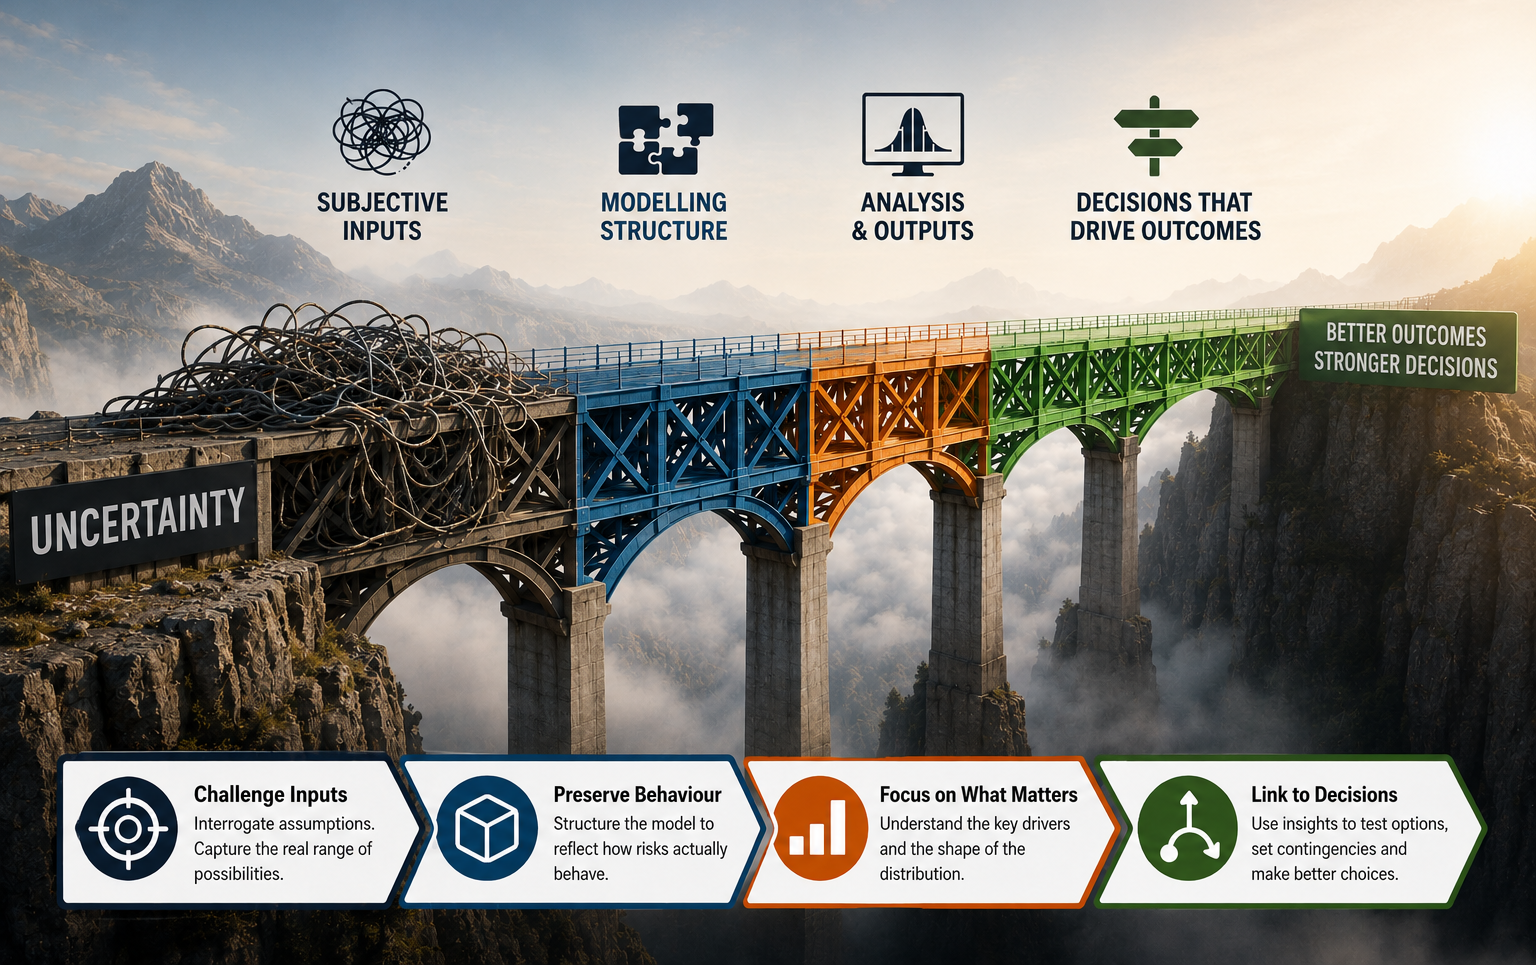
This is not about crowning a "best" distribution. It is about making the choice intentional, testable, and easy to explain.
Start with the uncertainty storyBounded or unbounded, how confident is ML, how plausible are tails?
Pick the simplest option that matches that storyStay simple unless there is a clear reason not to.
Test behaviour, not appearanceAsk: where will the model spend its time, low range, around ML, upper range?
Use @Risk to make the choice transparentOverlay multiple distributions on the same chart, same scale, then use markers and delimiters to quantify what changes.
Revisit as the project maturesIf knowledge changes, the distribution choice should be reconsidered too.
What's coming next
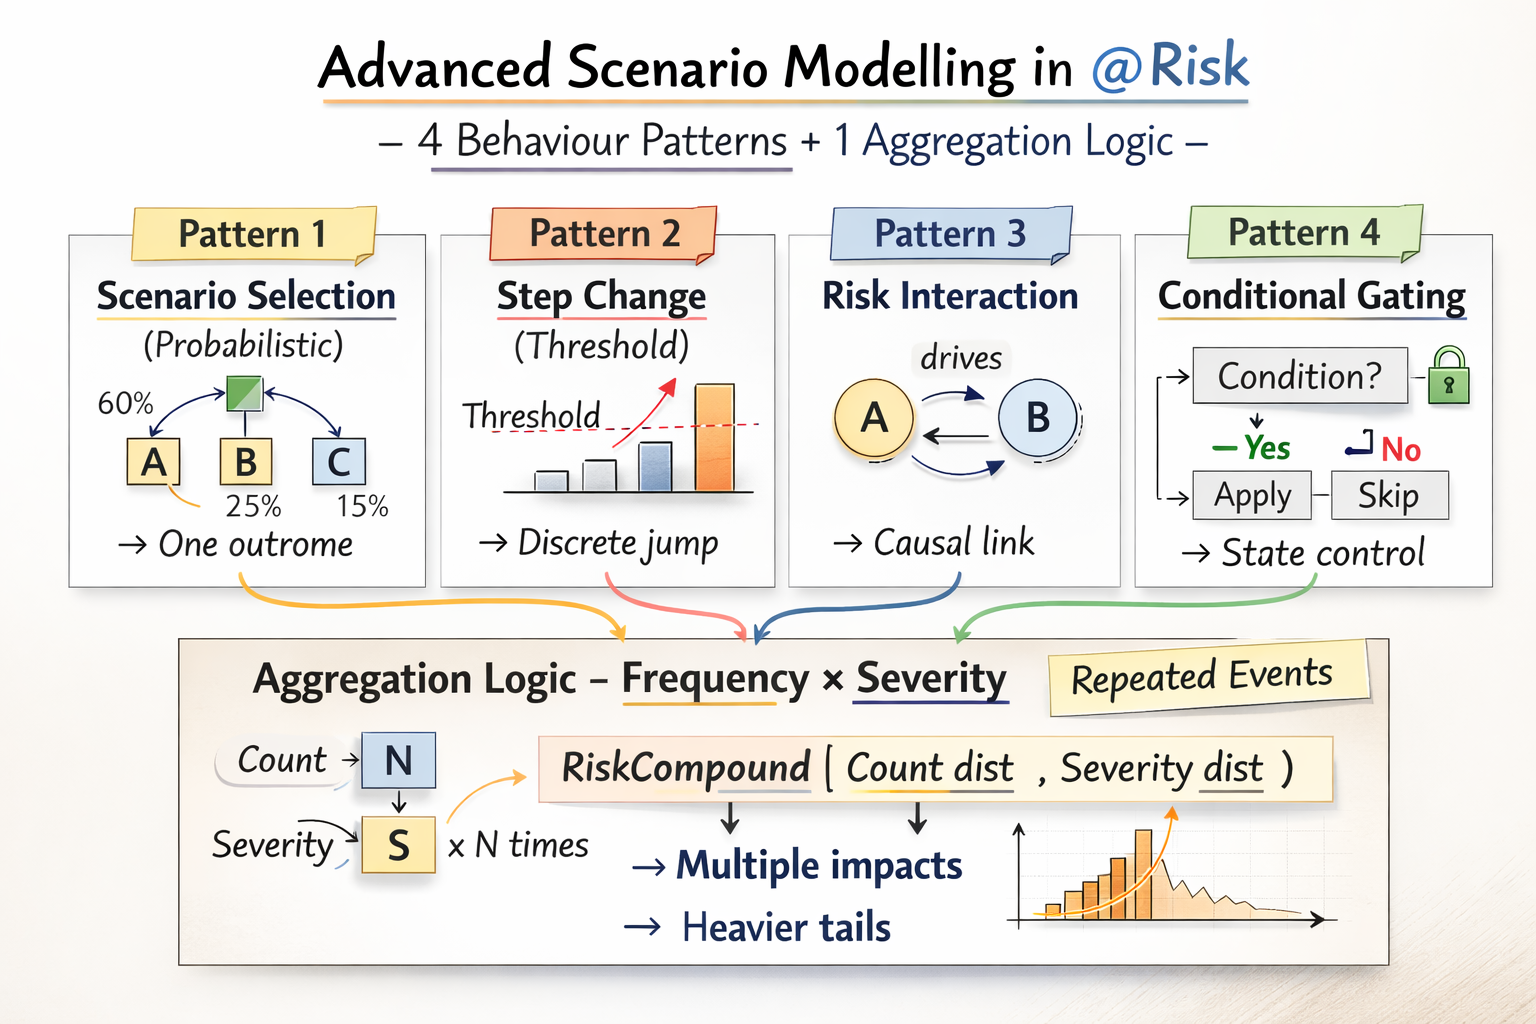
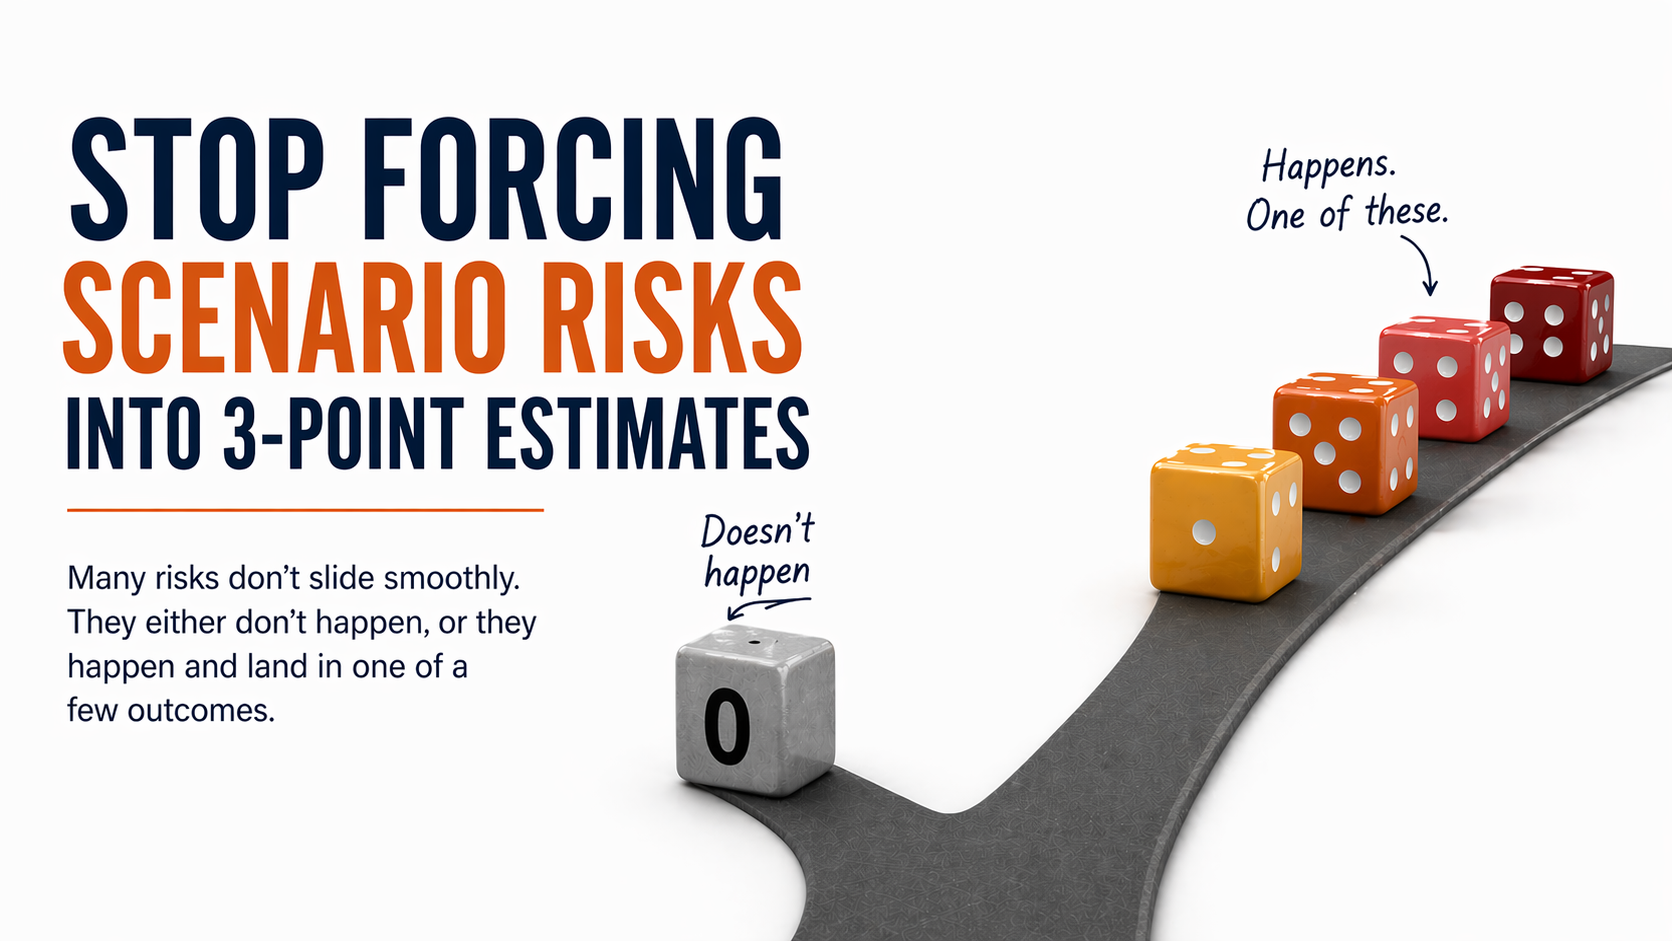
In the next article, I'll focus on scenario-style risks and sub-modelling. Many real project risks are not well-described by a single three-point estimate. They may or may not occur, and when they do, the impact is often better represented through discrete outcomes or bracketed profiles. I'll walk through practical modelling patterns in @Risk, including where simple PERT or triangular assumptions quietly flatten the tail.
The third article then steps up to model-level scenario patterns, including step-change impacts, hybrid scenarios with uncertainty inside each outcome, conditional logic, gating, and mutually exclusive outcomes. The emphasis will be on behavioural realism and defensible models that remain reviewable.
I'll close the series with two practitioner QA checklists for validating Monte Carlo results, QCRA and QSRA, before they are relied on in governance and decision-making.
If you've dealt with risks that do not fit standard approaches, or tackle these problems differently in practice, I'd genuinely like to hear your view.